SSD1306 126x64 OLED Display
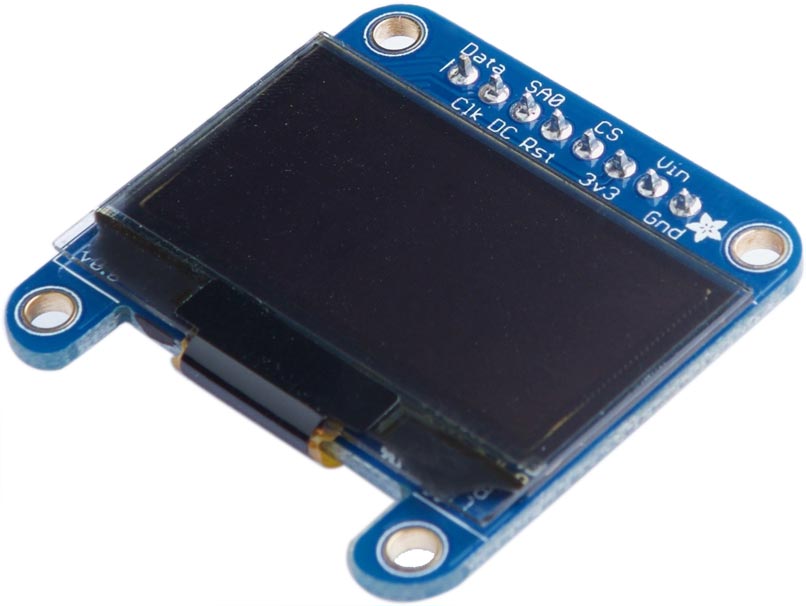
These routines allow you to plot data to an I2C 128x64 monochrome OLED display based on an SSD1306 driver chip. A suitable display is available from Adafruit [1]; to make it work via I2C you need to join two links on the back of the display:
A restriction of these routines is that they can only plot one value or pixel in each column, which avoids the need for a RAM buffer for the display. For many applications, such as plotting the value from a sensor against time, this is exactly what you want, so this minimal routine is ideal.
These routines are compact enough to run in uLisp on an Arduino Uno.
The display has the I2C address of #x3D or 61. Connect the SDA, SCL, and RESET pins to Data, Clk, and Rst respectively on the display.
These routines will also work on a 128x32 display, although obviously the y range will be reduced.
Routines
The display routines use the following function, to write bytes to the display:
(defun wbs (s &rest b)
  (dolist (i b) (write-byte i s)))
Initialising the display
The routine ini initialises the display:
(defun ini ()
  (with-i2c (s 61)
    (wbs s 0 #x8D #x14 #x20 #x01 #xA1 #xAF)))
After calling (ini) you should see a pattern of random dots on the display.
Plotting a point
The plot routine plt plots a point on the display at (x, y) where (0, 0) is the lower left corner of the display, x can be from 0 to 127, and y can be from 0 to 63.
(defun plt (x y)
  (with-i2c (s 61)
    (wbs s 0 #x21 x x #x22 0 7)
    (restart-i2c s)
    (write-byte #x40 s)
    (dotimes (p 8)
      (if (<= 0 y 7)
          (write-byte (ash 1 y) s)
        (write-byte 0 s))
      (setq y (- y 8)))))
Clearing the display
Finally, to clear the display call clr:
(defun clr () (dotimes (x 128) (plt x -1)))
For a simple test program to plot a sine wave see Simple data plotter.
- ^ Monochrome 1.3 126x64 OLED graphic display on Adafruit.